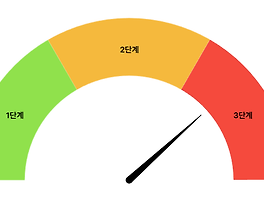
 label이 있는 gauage차트 highchart guage chart with label
See the Pen highchart guage chart with label by publisher.kim (@publisherkim) on CodePen. * 하이차트 전역 옵션 먼저 적용됨 (https://umings.github.io/file/highchart_common.js) Highcharts.chart('chart', { chart: { type: 'gauge', plotBackgroundColor: null, plotBackgroundImage: null, plotBorderWidth: 0, plotShadow: false, }, pane: { startAngle: -90, endAngle: 89.9, background: null, center: ['50%', '90%'], size:..
label이 있는 gauage차트 highchart guage chart with label
See the Pen highchart guage chart with label by publisher.kim (@publisherkim) on CodePen. * 하이차트 전역 옵션 먼저 적용됨 (https://umings.github.io/file/highchart_common.js) Highcharts.chart('chart', { chart: { type: 'gauge', plotBackgroundColor: null, plotBackgroundImage: null, plotBorderWidth: 0, plotShadow: false, }, pane: { startAngle: -90, endAngle: 89.9, background: null, center: ['50%', '90%'], size:..
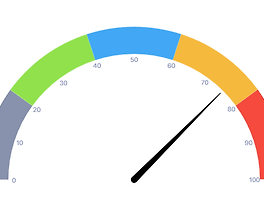 5단계 gauage chart highchart 5steps guage chart
See the Pen highchart 5steps guage chart by publisher.kim (@publisherkim) on CodePen. * 하이차트 전역 옵션 먼저 적용됨 (https://umings.github.io/file/highchart_common.js) Highcharts.chart('chart', { chart: { type: 'gauge', plotBackgroundColor: null, plotBackgroundImage: null, plotBorderWidth: 0, plotShadow: false, }, pane: { startAngle: -90, endAngle: 89.9, background: null, center: ['50%', '90%'], size: '15..
5단계 gauage chart highchart 5steps guage chart
See the Pen highchart 5steps guage chart by publisher.kim (@publisherkim) on CodePen. * 하이차트 전역 옵션 먼저 적용됨 (https://umings.github.io/file/highchart_common.js) Highcharts.chart('chart', { chart: { type: 'gauge', plotBackgroundColor: null, plotBackgroundImage: null, plotBorderWidth: 0, plotShadow: false, }, pane: { startAngle: -90, endAngle: 89.9, background: null, center: ['50%', '90%'], size: '15..
series 팁 (차트 hover액션 false / legend와 차트 영역에서 숨기기)
series: [{ name: '데이터1', data: [100, 70], enableMouseTracking: false, // 차트에 mouseover 액션 false }, { name: '데이터2', data: [50, 20], // 데이터 값 설정 visible: false, // 초기에 차트영역에서 숨김 "showInLegend": false, // legend에서 보이지 않게 숨김 }]
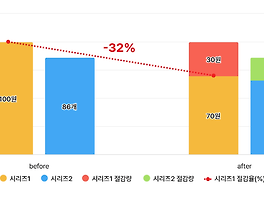 비교 차트 highchart compare chart
See the Pen highchart compare chart by publisher.kim (@publisherkim) on CodePen. * 하이차트 전역 옵션 먼저 적용됨 (https://umings.github.io/file/highchart_common.js) , jquery 필요 //chart Highcharts.chart('chart', { chart: { type: 'column', marginTop: 30, marginBottom: 80, }, title: null, subtitle: null, xAxis: { categories: ['before', 'after', ], plotBands: [{ from: 0, // Start of the plot band to: 1, // End ..
비교 차트 highchart compare chart
See the Pen highchart compare chart by publisher.kim (@publisherkim) on CodePen. * 하이차트 전역 옵션 먼저 적용됨 (https://umings.github.io/file/highchart_common.js) , jquery 필요 //chart Highcharts.chart('chart', { chart: { type: 'column', marginTop: 30, marginBottom: 80, }, title: null, subtitle: null, xAxis: { categories: ['before', 'after', ], plotBands: [{ from: 0, // Start of the plot band to: 1, // End ..
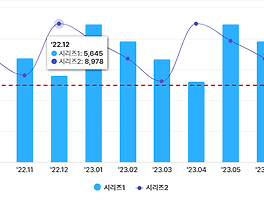 y축에 가로로 선 그리기 (plotLines) highchart yAxis line (plotLines)
보통 평균값, 기준값 등 나타낼때 쓰는듯. See the Pen highchart yAxis line (plotLines) by publisher.kim (@publisherkim) on CodePen. * 하이차트 전역 옵션 먼저 적용됨 (https://umings.github.io/file/highchart_common.js) //chart Highcharts.chart('chart', { xAxis: { categories: ["'22.09", "'22.10", "'22.11", "'22.12", "'23.01", "'23.02", "'23.03", "'23.04", "'23.05", "'23.06", "'23.07", "'23.08"], labels: { y: 20, }, }, yAxis: { p..
y축에 가로로 선 그리기 (plotLines) highchart yAxis line (plotLines)
보통 평균값, 기준값 등 나타낼때 쓰는듯. See the Pen highchart yAxis line (plotLines) by publisher.kim (@publisherkim) on CodePen. * 하이차트 전역 옵션 먼저 적용됨 (https://umings.github.io/file/highchart_common.js) //chart Highcharts.chart('chart', { xAxis: { categories: ["'22.09", "'22.10", "'22.11", "'22.12", "'23.01", "'23.02", "'23.03", "'23.04", "'23.05", "'23.06", "'23.07", "'23.08"], labels: { y: 20, }, }, yAxis: { p..
 seriese의 특정 data만 색상 다르게 넣기 highchart series one data color differnt
See the Pen highchart series one data color differnt by publisher.kim (@publisherkim) on CodePen. * 하이차트 전역 옵션 먼저 적용됨 (https://umings.github.io/file/highchart_common.js) Highcharts.chart('chart', { xAxis: { categories: ["'22.09", "'22.10", "'22.11", "'22.12", "'23.01", "'23.02", "'23.03", "'23.04", "'23.05", "'23.06", "'23.07", "'23.08"], labels: { y: 20, }, }, series: [{ name: '시리즈', type: 'col..
seriese의 특정 data만 색상 다르게 넣기 highchart series one data color differnt
See the Pen highchart series one data color differnt by publisher.kim (@publisherkim) on CodePen. * 하이차트 전역 옵션 먼저 적용됨 (https://umings.github.io/file/highchart_common.js) Highcharts.chart('chart', { xAxis: { categories: ["'22.09", "'22.10", "'22.11", "'22.12", "'23.01", "'23.02", "'23.03", "'23.04", "'23.05", "'23.06", "'23.07", "'23.08"], labels: { y: 20, }, }, series: [{ name: '시리즈', type: 'col..


