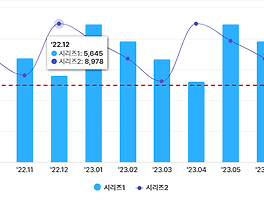
poinformatter를 사용하면 표출되는 형식을 바꿀수 있는데, 이럴때 기존 formatter 앞에 나오는 동그란 모양의 심볼(?) - 즉 해당 데이터가 어떤 시리즈인지 표시하는 색깔있는 원을 꼭 넣어주고 싶은 경우, 아래 소스 참고.
tooltip: {
    pointFormatter: function() {
      return '<span style="color:' + this.color + '">●</span> ' + this.series.name + ': <b>' + this.y  + '</b><br/>';
    },
    shared: true,
    useHTML: true,
  },
+ 필요한경우, point formater 아래에 footer format을 이용해 poinformatter를 수정하지 않고 토탈 값 등 추가 가능
footerFormat: '<b>Total: {point.total} </b>',728x90
'퍼블리싱 > highchart' 카테고리의 다른 글
| legend에서 특정 item의 click이 안되게 할때 옵션 (0) | 2023.09.13 |
|---|---|
| y축에 가로로 선 그리기 (plotLines) highchart yAxis line (plotLines) (0) | 2023.09.13 |
| 자주 쓰는 차트 전역 옵션 (0) | 2023.09.13 |
| seriese의 특정 data만 색상 다르게 넣기 highchart series one data color differnt (0) | 2023.09.13 |
| 1초 단위로 데이터가 들어가는 highchart (1) | 2023.05.16 |

